

Overview
The Dashboard shows organization admins the value Pam is delivering - how many conversations your org held, how many CRM entries Pam created, and an estimate of the time that saved. All figures cover the last 28 days, so it doubles as an adoption tracker while you roll Pam out.Before you start
- You need the Admin role, and access to the platform (app.wejam.ai/assistant/dashboard) - the Dashboard is not inside the Assistant app itself. It aggregates data across the whole org, so members without the Admin role don’t get an Activity entry in their sidebar at all.
Opening the Dashboard
On the platform, click Assistant in the sidebar, then Activity.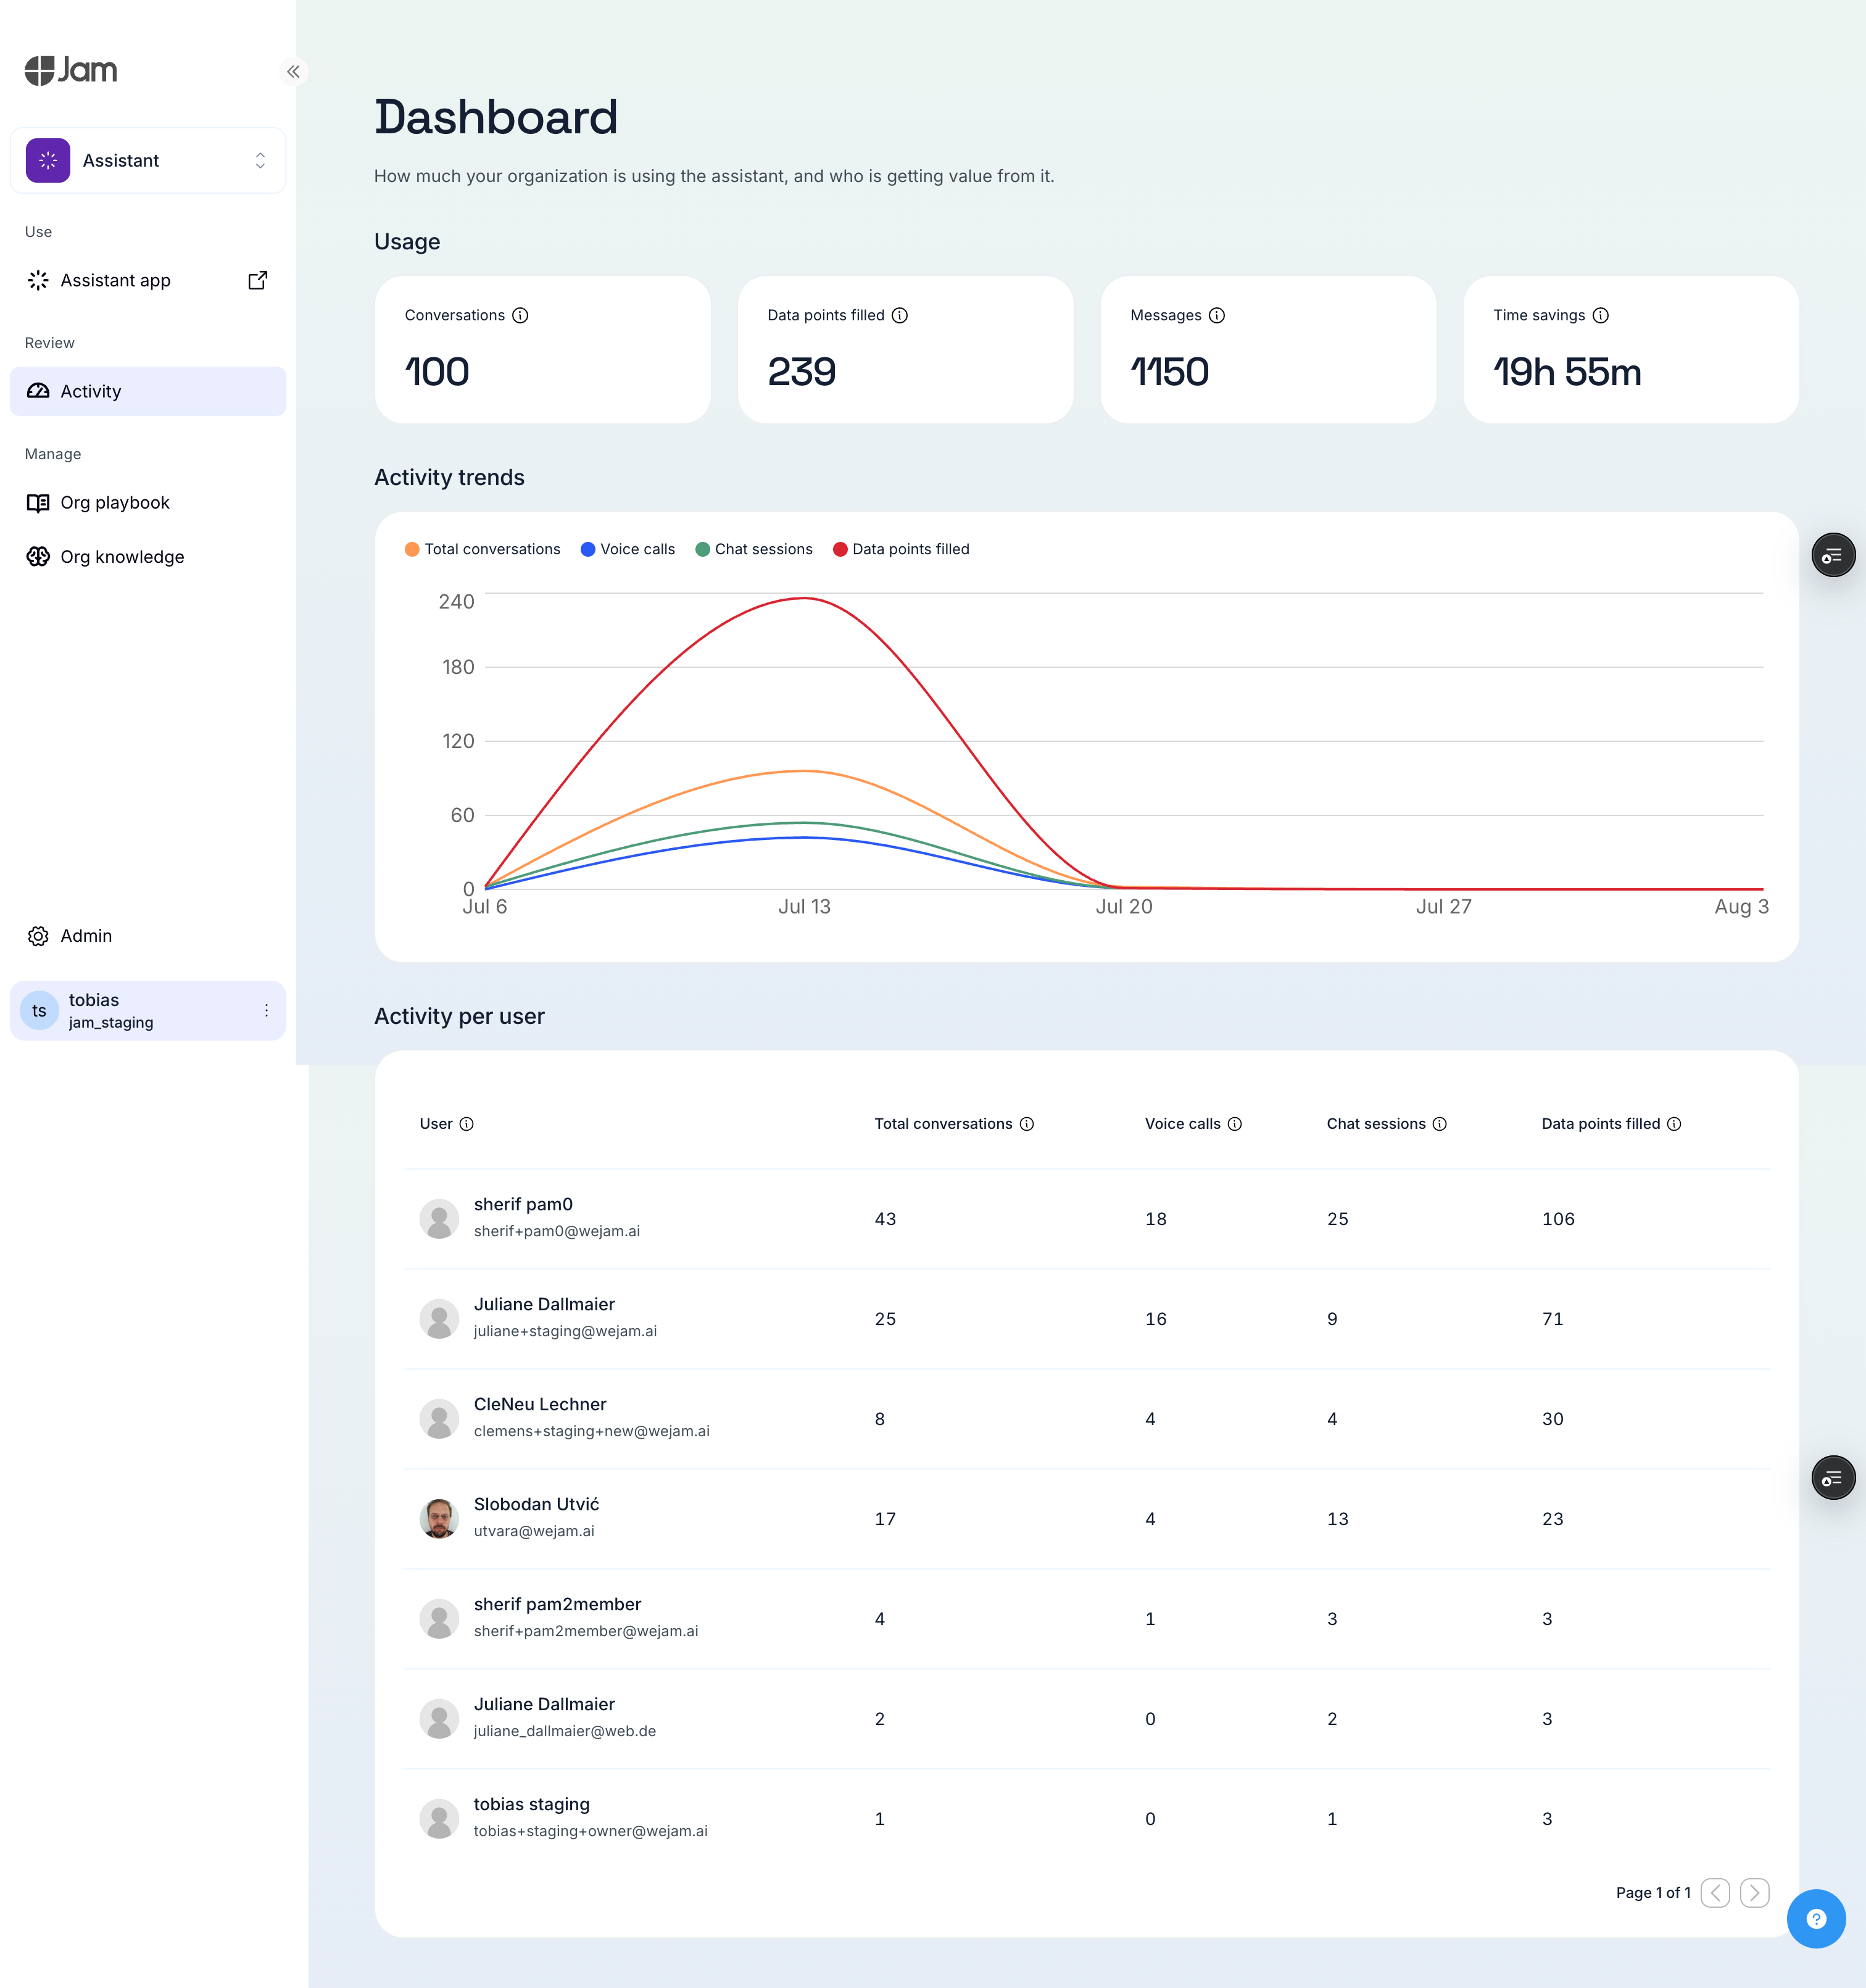
Reading the Team Activity cards
Four cards under Team Activity summarize the last 28 days:- Conversations - the voice calls and chat sessions your team held with Pam.
- Entries Created - the CRM actions Pam completed: contacts created, deals updated, notes logged.
- Messages - every message exchanged with Pam across those conversations.
- Time Savings - Entries Created multiplied by 5 minutes; the card’s “5min/entry” note is that formula. If manual CRM entry takes your team longer than 5 minutes, your real savings are higher.
A brand-new or demo workspace shows 0 everywhere. The figures fill in as your team starts talking to Pam.
Tracking week-by-week trends
The Activity Trends (Last 5 Weeks) chart plots four series for each week: Calls, Sessions, Total Conversations (calls and sessions combined), and Tool Calls (the CRM actions Pam performed). A single slow week is usually noise - holidays, travel season. A slide across several weeks is your cue to check in with the team or revisit your Playbook.Comparing entries by agent
Data Entries by Agent shows one bar per team member, sized by the CRM entries Pam created for them in the last 28 days. It’s the fastest way to spot who is getting real value from Pam and who hasn’t started. Until someone on the team completes a CRM action, the section reads “No CRM activity in the last 28 days”.What happens next
- The figures update automatically as your team uses Pam - check back weekly during rollout to watch adoption climb.
- Low numbers for specific people usually mean they haven’t tried Pam yet - a short intro or shared win from a colleague works better than a reminder email.
- High Conversations with low Entries Created means the team asks Pam questions but doesn’t let it write to the CRM - review your Playbook to encourage entry actions.
- Use the Time Savings card for ROI reporting to leadership - the 5-minute assumption is deliberately conservative.
Troubleshooting
Every metric shows 0
Every metric shows 0
Normal for a new or demo workspace - the Dashboard only counts real Pam conversations from the last 28 days. Once someone on the team completes a conversation, the cards update.
Data Entries by Agent shows no bars
Data Entries by Agent shows no bars
This chart only counts completed CRM actions (creates and updates) from the last 28 days. Conversations and messages alone don’t appear here - if the team chats with Pam but never lets it touch the CRM, this section stays empty.
Related articles
- Playbook - shape how Pam behaves for your team, including when it writes to the CRM
- Chat History - review individual conversations behind the numbers
- Getting Started - invite team members and manage access
Last updated: July 2026